Data & Research · 2026
What If Miami Had No Private Waterfront?
Reimagining Miami’s waterfront as a shared landscape.
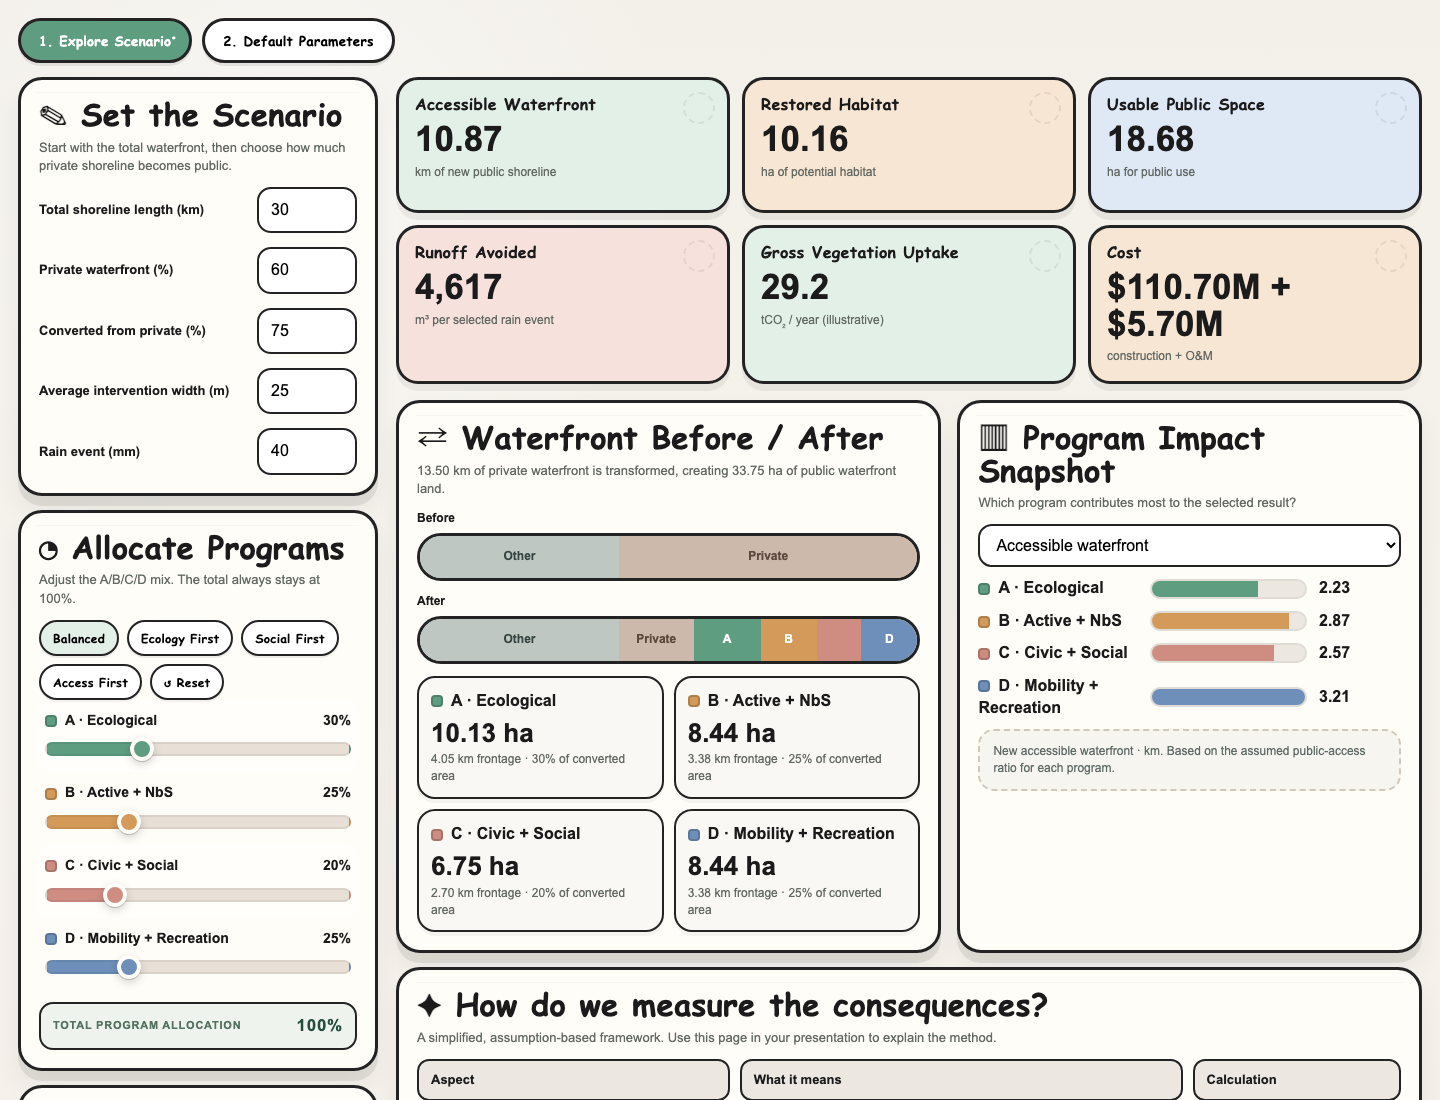
An interactive scenario calculator developed in a combined landscape and architecture studio, exploring what could change if Miami’s private waterfront became public.
What if the waterfront became public?
Developed in a combined landscape and architecture studio, this project asks what Miami might gain—and what it would take—if private waterfront were transformed into public space. It connects the design of the water’s edge with questions of access, ecological restoration, recreation, and the resources needed to build and maintain that landscape.
The interactive tool makes this question adjustable. Rather than committing to one fixed proposal, it lets a designer explore partial conversion or the full opening of private shoreline, then compare different ways of programming the resulting public land.
From shoreline to public landscape
The calculation begins with total shoreline length, the proportion that is private, the proportion of private shoreline to convert, and an assumed intervention width. Together, these define the length and area available for transformation.
Converted area = shoreline length × private share × conversion share × intervention width.
That area is distributed across four program types: Ecological, Active + Nature-based Solutions, Civic + Social, and Mobility + Recreation. The allocation sliders stay balanced at a total of 100%, making the spatial tradeoffs visible as a shared constraint.
Comparing different public futures
Balanced, Ecology First, Social First, and Access First presets provide starting points for comparison. Switching between them shows how the same converted waterfront can support different priorities.
The interface compares newly accessible shoreline, potential restored habitat, usable public space, avoided runoff for a selected rain event, gross annual vegetation CO₂ uptake, and construction and annual maintenance costs. A before-and-after shoreline diagram shows the spatial allocation, while a program-level chart reveals how each program contributes to the selected result.
CSV and SVG export connect the calculator to studio presentations: the scenario can be discussed through its assumptions, allocation, and consequences alongside architectural and landscape proposals.
Making the assumptions visible
An editable parameter table exposes the coefficients behind each program, including public access, habitat, usable area, vegetation coverage, runoff, and unit costs. The calculations use these coefficients to translate spatial choices into comparable indicators.
The current defaults are placeholders for scenario exploration, not site-verified Miami data. The outputs are conditional estimates rather than forecasts; the carbon indicator represents gross vegetation uptake rather than a complete carbon balance. This makes the tool a way to examine design priorities and identify what further evidence a proposal would need.